Understanding the Summary Drilldown Report
The
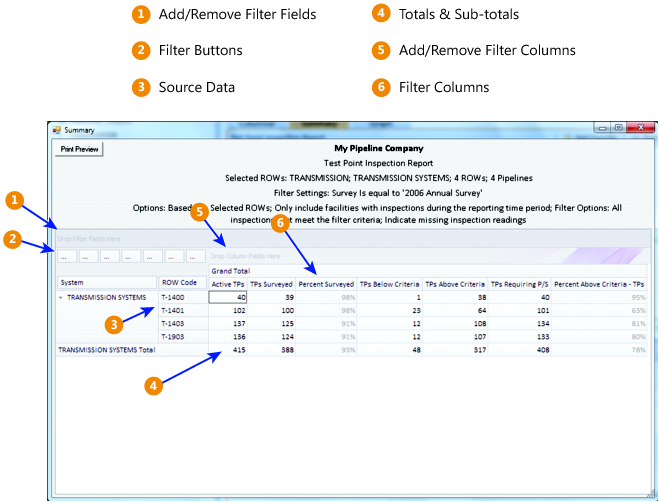
Summary report includes the
Drilldown option for displaying data in an interactive pivot table format (
Figure 16-20). This feature allows you to display different representations of the same summary data. You can add, remove, and rearrange filters to display a subset of summary data for easier analysis of large amounts of data. Double-clicking a field opens a window with detailed drilldown information for the selected summation type (
Figure 16-18). Percentage drill downs are currently unavailable. The following list describes operations you can perform in a pivot table:
• Arranging Column Fields in the Grid: The arrangement of filter buttons correspond to the arrangement of column fields in the grid. Dragging a filter button to a different position within the group of buttons subsequently rearranges column fields in the grid. Hovering the mouse over a filter button displays a tooltip with the filter name.
• Removing Column Fields in the Grid: Dragging a filter button to the area of the pivot table labeled “Drop Column Fields Here” removes the selected column from the grid.
• Removing Filters from Calculations: Dragging a filter button to the area of the pivot table labeled “Drop Filter Fields Here” removes the selected filter from calculations.
• Double-click a total or sub-total to view or print details in a drilldown table.
Figure 16-20. Summary Drilldown