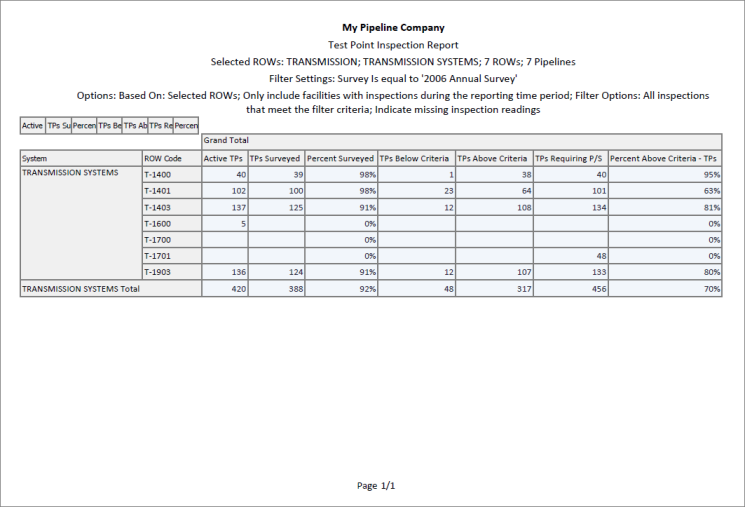
The summary report allows you to analyze large amounts of pipeline data easily in a familiar spreadsheet format. The report provides a summary of totals, subtotals, and aggregated numeric data (counts, sums, and percentages) for facilities on a pipeline. For example, you can use the report to easily determine the total number of facilities on a pipeline; total number and percentage of surveyed facilities; and total number and percentage of surveyed facilities above criteria (
Figure 16-17).
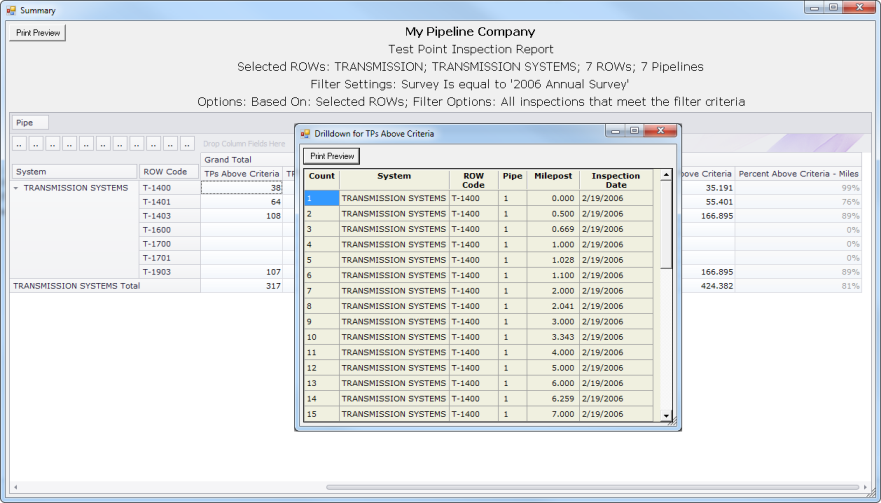
The summary report style provides an optional
Drilldown feature for viewing summary data in a pivot table. You can add, remove, and arrange data columns in the pivot table to obtain a desired report of summary data. Double-clicking a field in the grid opens a window with drilldown information as shown in the following example (
Figure 16-18).