Continuous Survey Reports
Reports available for selection include those in the following list:
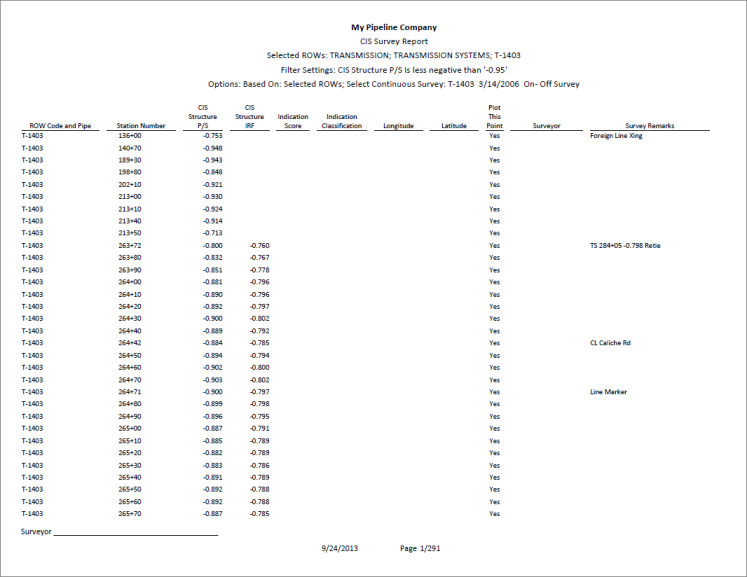
Continuous Survey Report
A report based on the columnar or graph report style that includes station numbers with associated survey readings for a selected survey folder and pipeline segment(s) selected in the
Select ROWs window. See
Figure 16-12 and
Figure 16-13.
Figure 16-12. Example of Continuous Survey Report (Columnar Report Style)
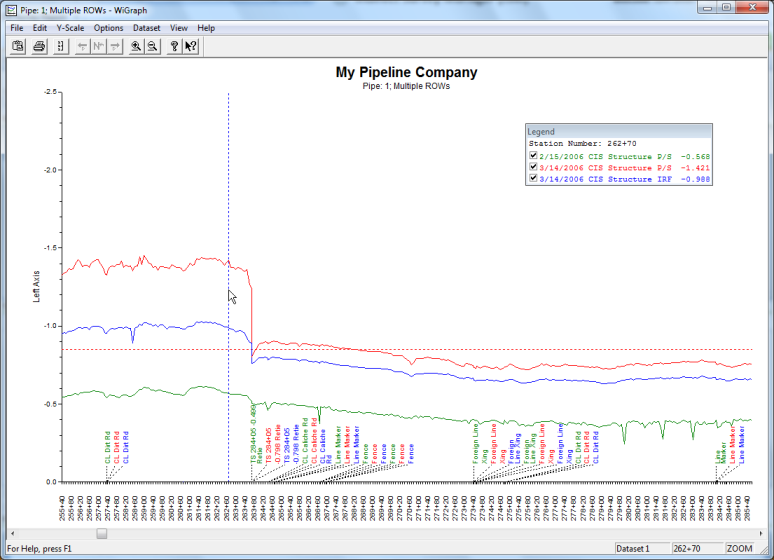
The next figure shows an example of the
Continuous Survey Report using the graph report style (
Figure 16-13).
Figure 16-13. Example of Continuous Survey Report (Graph Report Style)
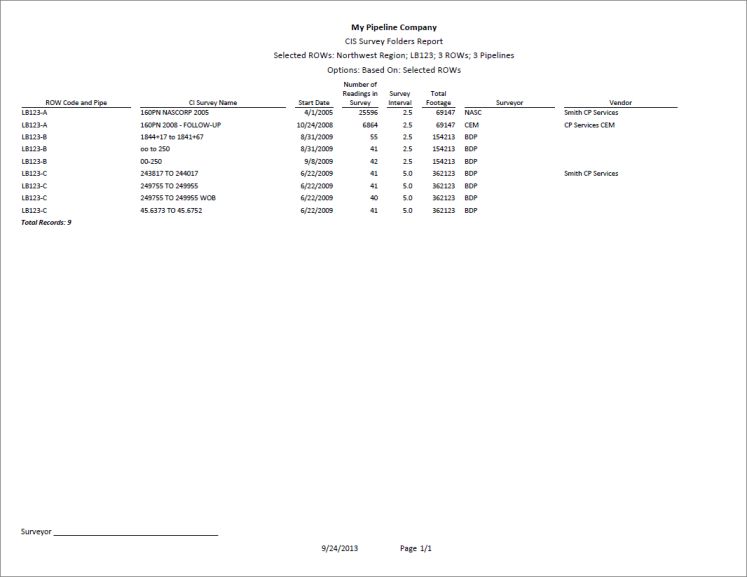
Continuous Survey Folders Report
A report based on the columnar report style that lists all survey folders associated with the currently selected pipeline segment in the
Select ROWs window. The report includes the survey folder name, start date, and total number of survey readings for each survey folder included in the report (
Figure 16-14).
Figure 16-14. Example of Continuous Survey Folders Report
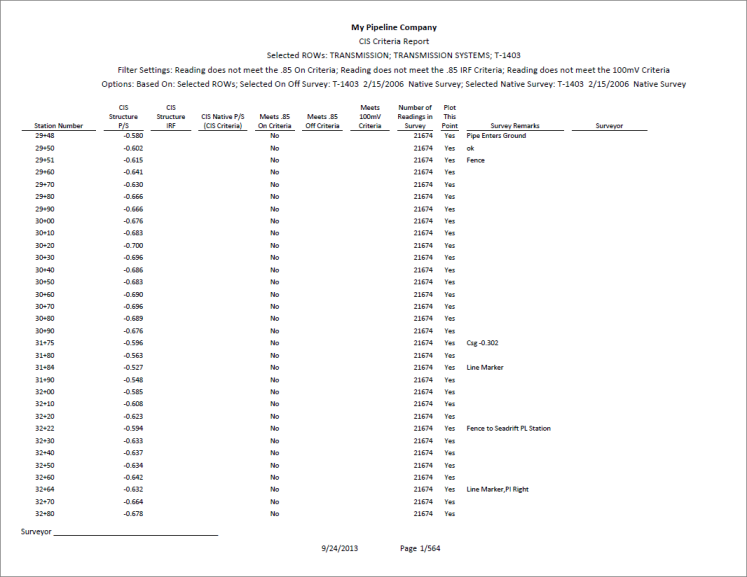
CIS Criteria Report (Continuous Survey)
A report based on the columnar report style that lists survey data for on/off and native state surveys.
The
CIS Criteria Report allows you to include or exclude survey readings based on the following fields: native (no cathodic protection); on potential (cathodic protection system on); and instant off (regular timed interruptions from the current source). If other report information is required, you can create a custom criteria report that meets those requirements. Report information also allows you to quickly determine if survey readings are out of specification or were recorded incorrectly (
Figure 16-15).
Figure 16-15. Example of CIS Criteria Report (Continuous Survey)