PCS Axis Reports
Reports available for selection include those in the following list:
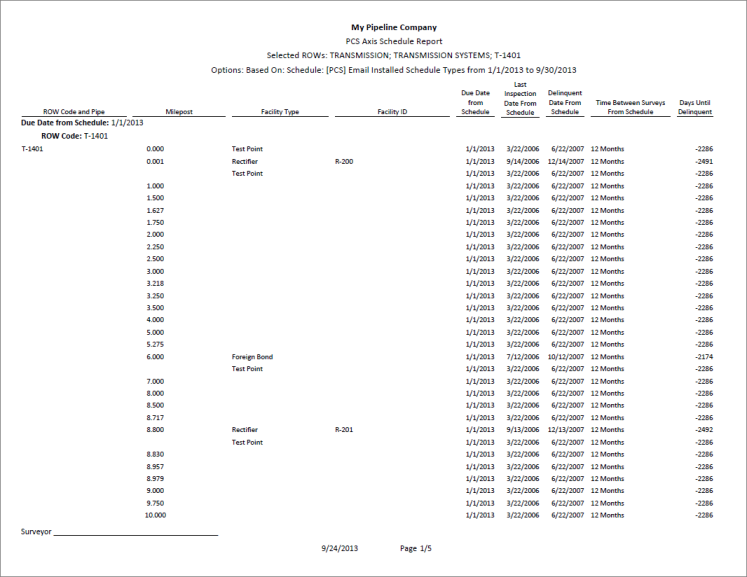
PCS Axis Schedule Report
The
PCS Axis Schedule Report lists facilities that require inspection using the schedule definition selected for the report. The schedule definition and a calculation based on the last inspection date and target survey month determine which facilities the report includes. Information is presented in a columnar report style in two formats: as a monthly calendar overview and as a detailed list (
Figure 16-1).
Figure 16-1. Example of PCS Axis Schedule Report
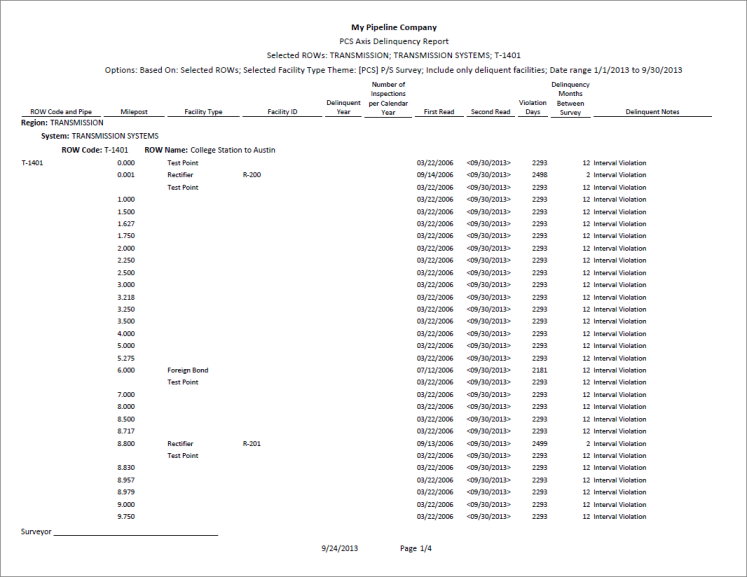
PCS Axis Delinquency Report
The
PCS Axis Delinquency Report is a compliance report that identifies delinquent facilities based on a survey schedule. Information is presented in a columnar style with a list of delinquent facilities, missing and surveyed facilities, facilities not included in a survey, and facilities below criteria (
Figure 16-2).
When the report is customized using the Summary report style, it is a statistical status report with a concise summary of the cathodic protection system. It includes the number of delinquent facilities, missing and surveyed facilities, and facilities below criteria. As an option, the report also provides drilldown functionality for further analysis of delinquent facilities.
The following example provides a description of how a facility is identified as delinquent and included in the report.
Example: A facility with a 12-month inspection cycle was initially inspected 1/15/2013. The facility became delinquent on 4/15/2014; this includes the 12-month inspection cycle plus the grace period. An inspection was recorded for the facility on 4/27/2014. If the report option labeled Include only delinquent facilities is not set, the facility is included in the Delinquency Report because it was delinquent from 4/15 to 4/26.
Figure 16-2. Example of PCS Axis Delinquency Report
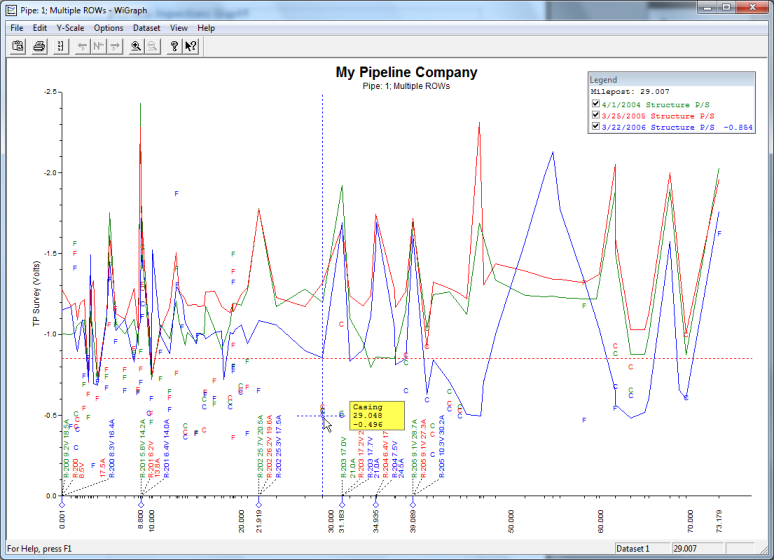
PCS Axis Inspections Graph
This report is a graph of inspection readings in a facility survey or survey readings in a continuous survey based on property settings in the Graph tab. Property settings include selection of one or more band fields, survey folders, and graph options. Band fields are equivalent to data fields in a data entry grid, such as Structure P/S in the Edit CPDM Data grid and CIS Structure P/S in the Edit ISM Data grid.
Areas of the graph with spikes indicate areas where survey data should be reviewed closely (
Figure 16-3). Locations in the graph marked with the letter “C” indicate
Casing P/S. Those marked with the letter “F” indicate
Foreign Bond. Hovering the mouse over either of these captions displays a yellow tooltip with measurement data as shown in the next example. To toggle these and other captions on or off when viewing the graph, click
Options and then click a check box labeled with the caption you want to toggle on or off, such as
Show Casing P/S.
Figure 16-3. Example of PCS Axis Inspections Graph