Adding a Summary Report Layout Theme
A layout theme is a group of named settings saved for later use. You can define a
Summary layout theme with report settings that define the table row, column, and data fields as well as the aggregate functions (average, sum, count, and percentage) used to calculate data fields in a
Summary report. Summation fields, field operators, filters, drilldown fields, drilldown

sorting fields, horizontal and vertical field groupings, as well as paper settings can all be saved in a
Summary layout theme.
A Summary report presents data in a cross tab table view. It provides a “big picture” of pipeline and facility data by summarizing and analyzing the data. You can control how PCS Axis summarizes the data, for example by sum, average, count, or percentage. Using a Summary report can help with analyzing data, making comparisons, and detecting patterns in the pipeline system.
To add a Summary layout theme, follow these steps:
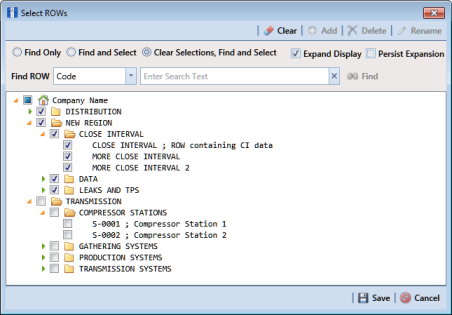
1 Select one or more pipeline segments in the
Select ROWs window
(Figure 16-35). Choose pipeline segment(s) with facilities you want to include in the report. Click
 Save
Save to close the window.
Figure 16-35. Select ROWs
2 Choose the report you want to work with in the Reports/Graphs menu. Click Report/Graphs and then select a report, such as the Test Point Inspection Report.
3 Click the
Summary tab

, then the
Customize tab

.
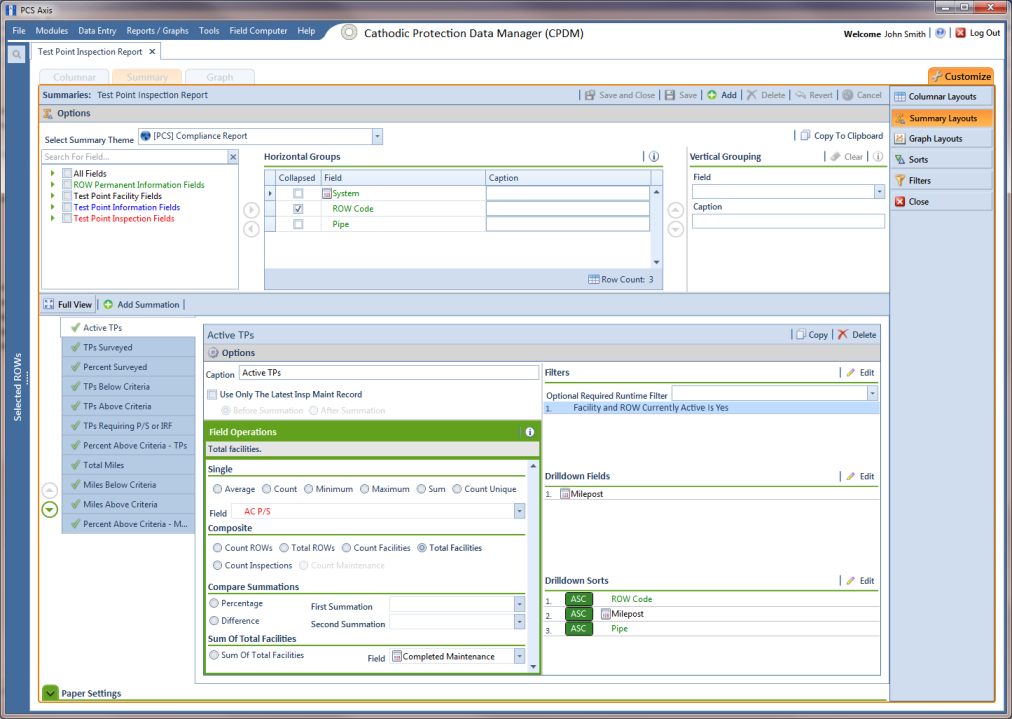
4 Click the
Summary Layouts button
to open the
Summaries page (
Figure 16-36).
Figure 16-36. Summary Layouts
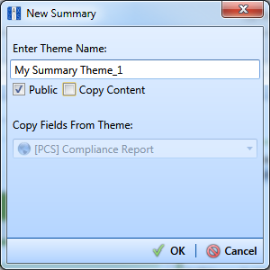
5 Click
 Add
Add to open the
New Summary dialog box (
Figure 16-37).
Figure 16-37. New Summary
6 Type a name for the Summary layout theme in the field Enter Theme Name. If you want to create a public theme, click the Public check box to place a check mark inside the check box. When the check box is empty, the summary theme saves as a private theme.
Note: Themes are either public or private. A public theme is available for use by all PCS Axis users. A private theme is available only to the user who creates it.
7 If you want to copy fields from another Summary layout theme, click the Copy Content check box and then click the down arrow in Copy Fields From Theme and select a theme in the selection list.
8 Click
 OK
OK to save changes and return to the
Summaries page.
9 Complete the following steps to select one or more PCS Axis fields to be used as horizontal table rows in the report. Field selections display in the Horizontal Groups panel. In a Summary report, these fields display horizontally on the left side of the report.
a Click the toggle arrow

for a field category in the
Search For Field panel to view a list of fields available for selection. For example, click
 All Fields
.
b Double-click a field in the Search For Field Panel to move it to the Horizontal Groups panel. Repeat this step as needed.
As an example, when selecting System and ROW Code, each time a System table row is included in the report, a ROW Code table row is also included.
c If you want the data collapsed for a table row when you first open the Summary report, click the Collapsed check box for that table row in the Horizontal Groups panel. An expand/collapse button is available when viewing the report to expand and collapse data as needed.
d If you want to rename the caption of a table row, type a name in the Caption field for that table row. When this field is empty, the caption of the table row uses the default PCS Axis description.
Note: Clicking the

information button in the
Horizontal Groups,
Vertical Grouping, or
Field Operations panel opens a window with information related to current property settings.
e To change the order of fields in the Horizontal Groups panel and subsequently in the Summary report, click and drag a field to a new position in the grid. Or, select a field and then click the up

or down

button.
10 Vertical Grouping is an optional setting. It allows you to group horizontal table rows by a vertical column. For example, selecting Inspection Date displays data by Month, Quarter, or Year based on the Data Group Interval option you select.
To group horizontal table rows by a vertical column, complete the following steps in the Vertical Grouping panel:
a Choose a PCS Axis field you want to use as the vertical column. Click the down arrow in Field and select a field in the selection list.
b If you want to use a different caption other than the name of the selected PCS Axis field, type a name in the Caption field.
11 Click
 Full View
 to hide the field selection,
Horizontal Groups, and
Vertical Grouping panels. Clicking
Full View again displays these panels.
12 Identify how you want data calculated. Set up one or more summations in the following manner:
a Click
 Add Summation
.
b Choose an aggregate function used to calculate data fields (average, sum, count, or percentage). Click an option in any of the following group boxes: Single, Composite, or Sum Of Total Facilities.
c If you selected an option in the group box labeled Single or Sum Of Total Facilities, click the down arrow in Field and select the PCS Axis field you want to use in the calculation.
d If you want to compare two summations, select Percentage or Difference in the Compare Summations group box. Then click the down arrow in the field First Summation and select a summation. Click the down arrow in the field Second Summation and select the second summation.
e Repeat
step 12 "a" through
"d" as needed to add additional summations.
Note: To delete a summation, select a summation tab and then click
 Delete.
 Click
Yes when the
Delete message displays.
13 If you want to filter the data output in the report, click the down arrow in the field
Optional Required Runtime Filter and select a PCS Axis field in the selection list. Or, click
Edit to set up an
AND or
OR filter group. See
Working with Report Themes and Filter Groups for related information.
14 Click Edit in the Drilldown Fields group box and select one or more fields you want to use as drilldown fields. When viewing the report in PCS Axis, clicking a drilldown field displays another data view with more information about the field.
15 Click
Edit in the
Drilldown Sorts group box and select one or more fields that determine how data sorts. Click
ASC 
to sort data in ascending order or
DESC 
to sort in descending order.
16 Click
 Paper Settings
 and set paper, font, and print options as needed.
17 Click
 Save
Save.