Working with a Report Based on the Graph Style
Complete the following steps to set up and print or export a report based on the Graph report style:
Complete the following steps:
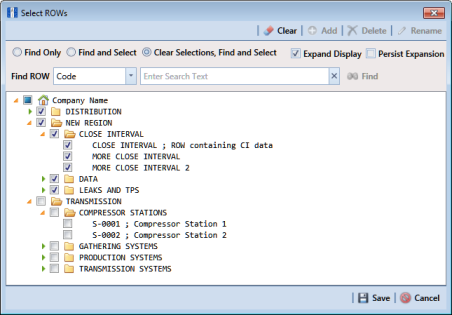
1 Select one or more pipeline segments in the
Select ROWs window (
Figure 16-25). Choose pipeline segment(s) with facilities you want to include in the graph. Click
 Save
Save to close the window.
Figure 16-25. Select ROWs
2 Click Reports/Graphs and select a report in the menu.
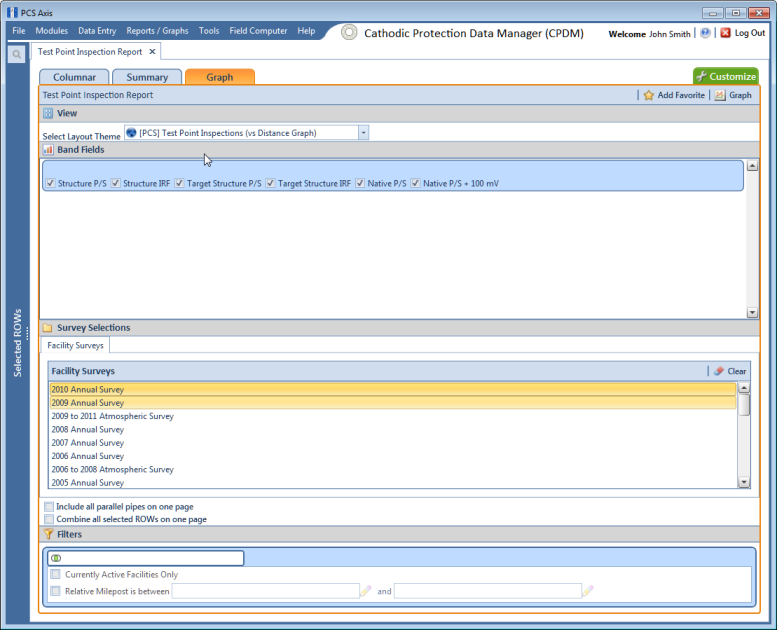
3 Click the
Graph tab

to open a property settings window. For example, the next figure shows the property settings window for the
Test Point Inspection graph (
Figure 16-26).
4 Click the down arrow in the field Select Layout Theme and choose a layout theme in the selection list.
5 In the Band Fields group box, click the check box for more or more types of survey data you want to include in the graph.
6 Select one or more Facility Surveys in the Survey Selections group box. To select facility surveys in sequential order, press Shift and then click each survey. To select facility survey in non-sequential order, press Ctrl and then click each survey.
7 To include all parallel pipelines on one page, click the check box Include all parallel pipes on one page.
A check mark inside the check box indicates a selection. To clear the selection, click the check box again to remove the check mark.
8 To combine all selected pipelines on one page, click the check box Combine all selected ROWs on one page.
9 Select one or more options in the Filters group box to filter graph data according to your filter selection(s). For example, click Currently Active Facilities Only to only include currently active facilities in the graph.
Figure 16-26. Test Point Inspection Graph Report
10 If you want to add the graph in
Favorite Reports, click
 Add Favorite
.
Note: If you want to remove a favorite report listed in
Favorite Reports, open the report and then click
 Remove Favorite
 in the report options window.
11 To view the graph, click
 Graph
Graph to open the graph in a preview window. Then click the
 Print
Print button to print the graph.