Working with a Report Based on the Columnar Report Style
Complete the following steps to set up and print or export a report based on the Columnar report style:
Complete the following steps:
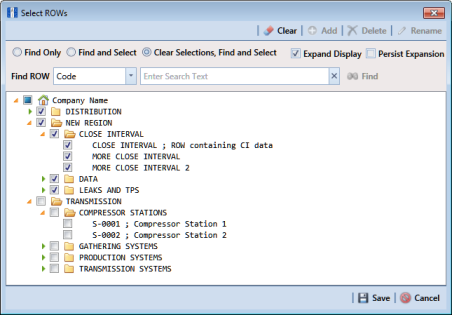
1 Select one or more pipeline segments in the
Select ROWs window (
Figure 16-21). Choose pipeline segment(s) with facilities you want to include in the report. Click
 Save
Save to close the window.
Figure 16-21. Select ROWs
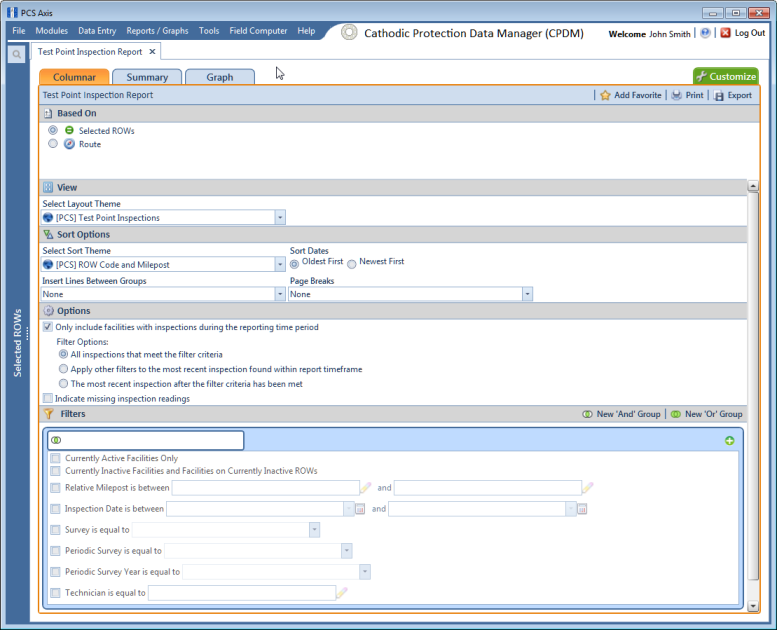
2 Click
Reports/Graphs and then select a report in the menu to open a window with report property settings. If the
Columnar property settings window is not visible, click the
Columnar tab

to open the window (
Figure 16-22).
The following figure shows an example of the
Columnar property settings window for the
Test Point Inspection Report (
Figure 16-22).
Figure 16-22. Test Point Inspection Report
3 Select one of the following options to choose which facility records to include in the report:
a Click the option Selected ROWs to include facilities associated with the pipeline selection(s) in the Select ROWs window.
b Click the Route option and then select a route to include facilities associated with the selected route.
4 Click the down arrow in the field Select Layout Theme and choose a layout theme in the selection list. The layout theme determines which fields are included in the report, paper and font settings, and additional print options such as including a signature line in the report.
Note: Only public themes are available for selection. If you would like to use a private theme, your company’s system administrator must make your private theme a public one.
5 Click the down arrow in the field Select Sort Theme and choose a sorting theme in the selection list. The sorting theme determines how PCS Axis sorts report data.
6 Choose a method for sorting inspection dates. Click Oldest First or Newest First in Sort Dates to sort records with the oldest or newest inspection dates first.
7 Choose an option for inserting a line between different groups of report data. Click the down arrow in the field Insert Lines Between Groups and choose an option in the selection list.
8 Choose an option that determines where a page break occurs in the report. Click the down arrow in the Page Breaks field and select an option in the selection list.
9 Select one or more of the following options as needed in the Options group box. Date range in filter criteria is determined by considering all time frame filters, such as inspection date, survey, and periodic survey filters.
• Only include facilities with inspections during the reporting time period: When time frame filters are not selected in the Filters group box, such as inspection date, survey, or periodic survey filters, the report includes all inspections using the inspection date and time as the reporting time period.
If one or more time frame filters are selected in the Filters group box, the report only includes inspections for the selected time frame filter(s).
• All inspections that meet the filter criteria: Report includes all inspections that meet filter criteria based on selections in the Filter group box.
• Apply other filters to the most recent inspection found within report timeframe: This option finds the latest inspection within the reporting time frame first, and then applies all other filters selected in the Filter group box. The report only includes inspections for facilities when the latest record within the date range meets other filters.
• The most recent inspection after the filter criteria has been met: This option applies all filter criteria first based on selections in the Filter group box, and then finds the latest inspection.
• Indicate missing inspection readings: This option includes an empty box in the report for each missing inspection reading.
10 Select one or more options in the Filters group box to filter report data according to your filter selection(s). For example, click Currently Active Facilities Only to only include currently active facilities in the report.
Note: PCS Axis disables the option Only show facilities with inspection records when the Columnar report includes any of the following filter settings: Inspection Date is between, Survey is equal to, Periodic Survey is equal to, or Periodic Survey Year is equal to.
When adding a date filter, such as Inspection Date is between, set a date range using a calendar or dynamic dates in the following manner:
• To set a date range using a calendar, click the down arrow in the start date field to open a calendar and select a date. Repeat this step for the end date field.
• To set a date range using dynamic start and end dates, click the

calculator button in the start date field and set up dynamic date properties. Repeat this step for the end date field. Clicking the calculator button opens and closes dynamic date property fields.
11 If you want to add the report in
Favorite Reports (Reports/Graphs > Favorite Reports), click
 Add Favorite
.
Note: If you want to remove a favorite report listed in
Favorite Reports, open the report and then click
 Remove Favorite
 in the report options window.
12 To export the report:
a Click
 Export
 to open the
Export File dialog box.
b Choose an export file type. Click the down arrow in the Save as type field and select one of the following file types:
• Excel files (*.xlsx)
• Text files (*.txt, *.csv)
• XML files (*.xml)
13 To print the report:
a Click
 Print
Print to open the report in a preview window.
b To print the report using the default printer set up in Windows, click the
 Quick Print
 button. To select a printer other than the default printer, click the
 Print
Print button.