View a Survey Record Waveform
When one or more survey records in a stationary survey include an associated waveform, click the
 Show Waveform
 button to open the
WaveForm window and view survey measurements in both a graph and a grid.
To view a survey record waveform, follow these steps:
1 Select the pipeline segment(s) you want to work with in the
Select ROWs window (
Figure 14-2).
2 Click Data Entry > Stationary Survey Maintenance to open the Stationary Survey Maintenance window.
3 Click the down arrow in the
Date range field and select an option in the selection list to filter the data view in the
Stationary Surveys grid. Then click
 Refresh.
 4 Select a stationary survey in the
Stationary Surveys grid and then click
 Show Waveform
 to open the
Waveform window (
Figure 14-10).
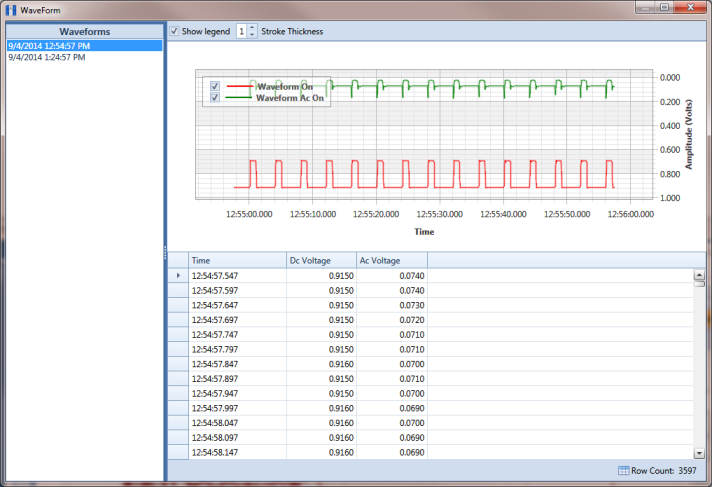
Figure 14-10. WaveForm
The waveform supports the following functions:
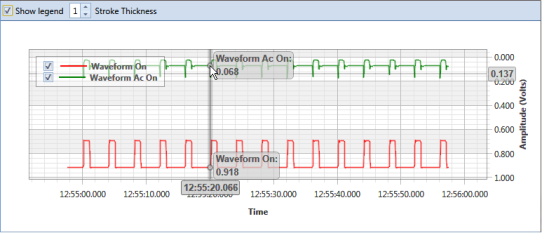
• Tooltips with ON/OFF Measurements: Placing the mouse over a point in the waveform displays tooltips with corresponding ON/OFF voltage measurements (
Figure 14-11).
• Show Legend: Select this check box to show or hide the graph legend. You can also click one or more check boxes in the graph legend to hide or show the selected graph element.
• Stroke Thickness: Click the up/down arrows to adjust the thickness of the graph line. You can also type a value in this field to adjust the thickness.
Figure 14-11. Tooltips with ON/OFF Measurements
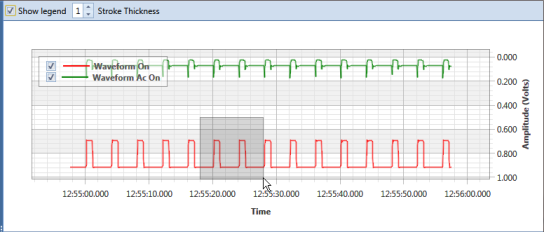
• Zoom In: Click and hold the mouse while dragging a selection over the graph to zoom in on the selected area of the graph. Double-click anywhere inside the graph to return to normal graph view (
Figure 14-12).
Figure 14-12. Zoom In On Graph