Using Spike Filtering
Spike filtering is available only when working with a close interval survey (CIS). Use spike filtering to exclude inaccurate survey readings in graphs and reports that are typically due to poor contact between the soil and reference electrode. Using this feature allows you to consider only those survey readings that are accurate when analyzing survey data.
Inaccurate readings are excluded based on a percentage value you specify for the filter. PCS Axis compares the on/off values of the current reading with the on/off values of the previous and next reading. If the current survey reading differs from the previous and next survey reading by more than the percentage allowed, PCS Axis disables the option Plot This Point for the current survey reading and also excludes it in the CIS Survey Graph report.
To apply spike filtering to a range of station numbers, follow these steps:
1 Click the
Select ROWs button

to open the
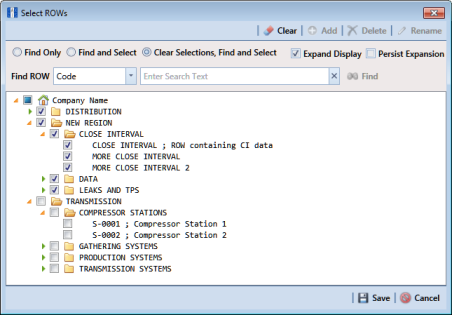
Select ROWs window (
Figure 7-92). Select the pipeline segment(s) with the facilities you want to work with, then click
 Save
Save to close the window.
Figure 7-92. Select ROWs
2 If the ISM module is not open, click Modules > Indirect Survey Manager (ISM).
3 Click
Data Entry >
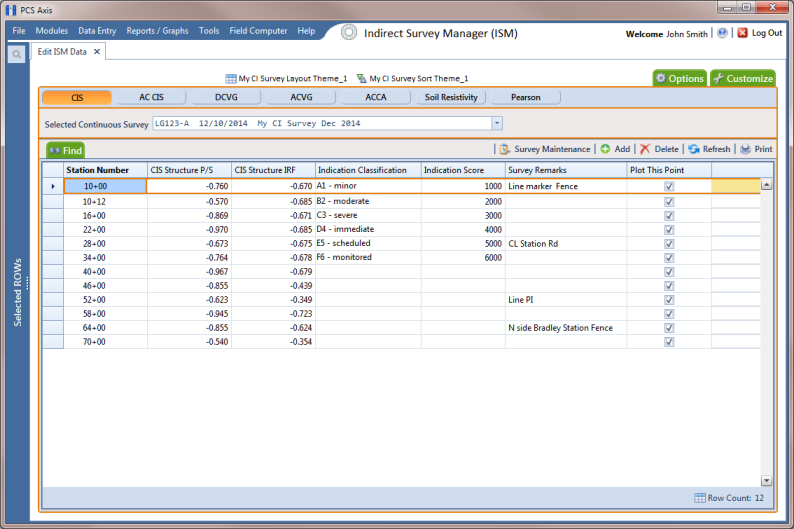
Edit ISM Data to open the ISM data entry grid. Then click the
CIS button

to work with a close interval survey (
Figure 7-93).
4 Select a survey folder with station numbers you want to apply Spike Filtering. Click the down arrow in Selected Continuous Survey and select a survey folder in the selection list.
Note: If you want to collapse the Selected ROWs panel, click the Selected ROWs bar. Clicking the bar again expands the panel.
Figure 7-93. Edit ISM Data
5 Click
 Survey Maintenance
 to open the
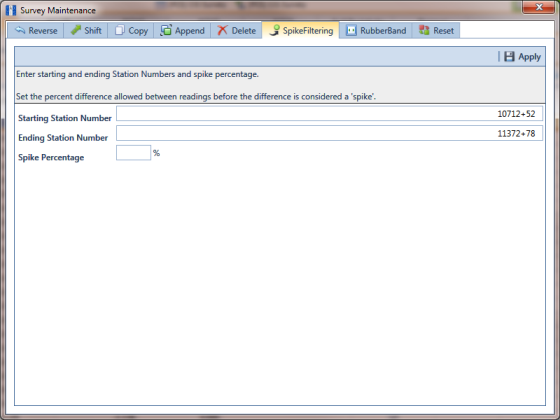
Survey Maintenance dialog box. Then click
 SpikeFiltering
 (
Figure 7-94).
6 Type a starting station number in the field Starting Station Number and an ending station number in the field Ending Station Number.
7 Type a value in the Spike Percentage field. Valid entries are in a range of 1-99.
Note: Clicking the Windows close button

cancels the operation and closes the dialog box.
8 Click
 Apply
Apply and then click
 OK
OK when a status message displays.
The option Plot This Point is disabled in the data entry grid only for station numbers that meet Spike Filtering criteria.
Figure 7-94. Spike Filtering