Graph Report Style
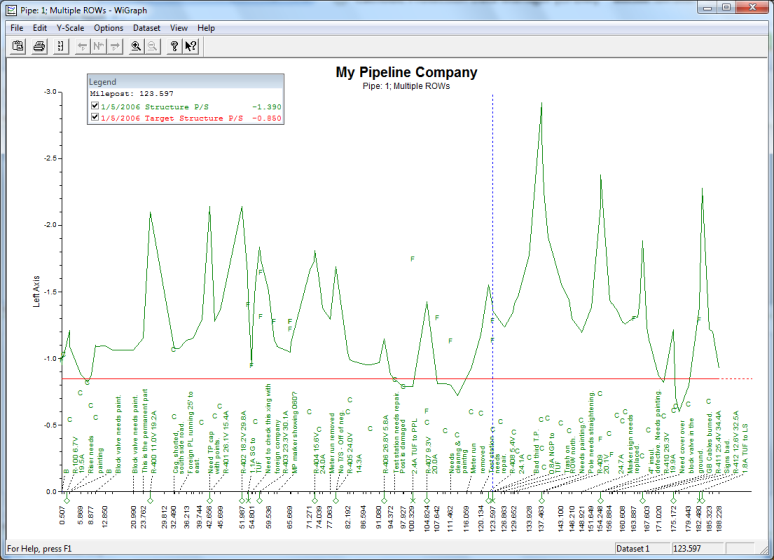
A graph report presents data in a line graph format. The report shows survey data versus distance or time. As an option you can set up the report to graph several bands of survey data. Each band includes an X-axis, Y-axis, and survey readings.
Figure 16-19. Example of Graph Report Style